
Engage a Cartographer
When it comes to mapping, quality matters — and so does credibility. A screenshot with some lines drawn over it might get the job done, but it doesn’t communicate accuracy or professionalism. That’s where we come in.
TerraLab’s cartographers specialise in creating clear, reliable, and visually engaging maps for reports, publications, planning documents, and technical communication. We supplement your data with authoritative base layers, high-resolution imagery, and polished cartographic design. Fast and at surprisingly competitive rates.
Our maps don’t just look good, they support better decisions.
Looking to take your mapping further? We also design:
Web maps
Interactive mapping applications
Mobile mapping tools
These dynamic solutions are perfect for:
Projects with evolving data
Collaborative teams
Public engagement or citizen science
Real-time field data capture
Send us a message …
Project Examples
Wind Farm Visibility and Impact Mapping
Objective:
To assess and communicate the visibility, shadow flicker, and noise impacts of a proposed wind farm using maps and a 3D web application.
Approach:
Working with early-stage development data, TerraLab performed visibility and impact modelling across the landscape. We mapped sightlines from key vantage points and modelled the extent of shadow flicker and noise zones.
Result:
A suite of A2-sized technical maps was produced for planning and community consultation, alongside a 3D interactive web map allowing users to explore turbine visibility from multiple perspectives.
Water Quality Modelling and Visualisation
Objective:
To model and visualise stream water quality based on limited point-sampled data.
Approach:
In collaboration with the project’s lead consultant, TerraLab developed an interpolation method to model spatial variation in water quality along a stream corridor.
Result:
A series of maps was produced showing water quality as colour gradients, enabling clear visual interpretation of changes across the catchment. These were used in technical reports and stakeholder presentations.
Need high-quality maps for your next project? Contact us to get started.
What We Offer:
We provide a wide range of cartographic and mapping services tailored to your project’s needs. From traditional maps to web applications and advanced spatial modelling.
Print & Static Mapping
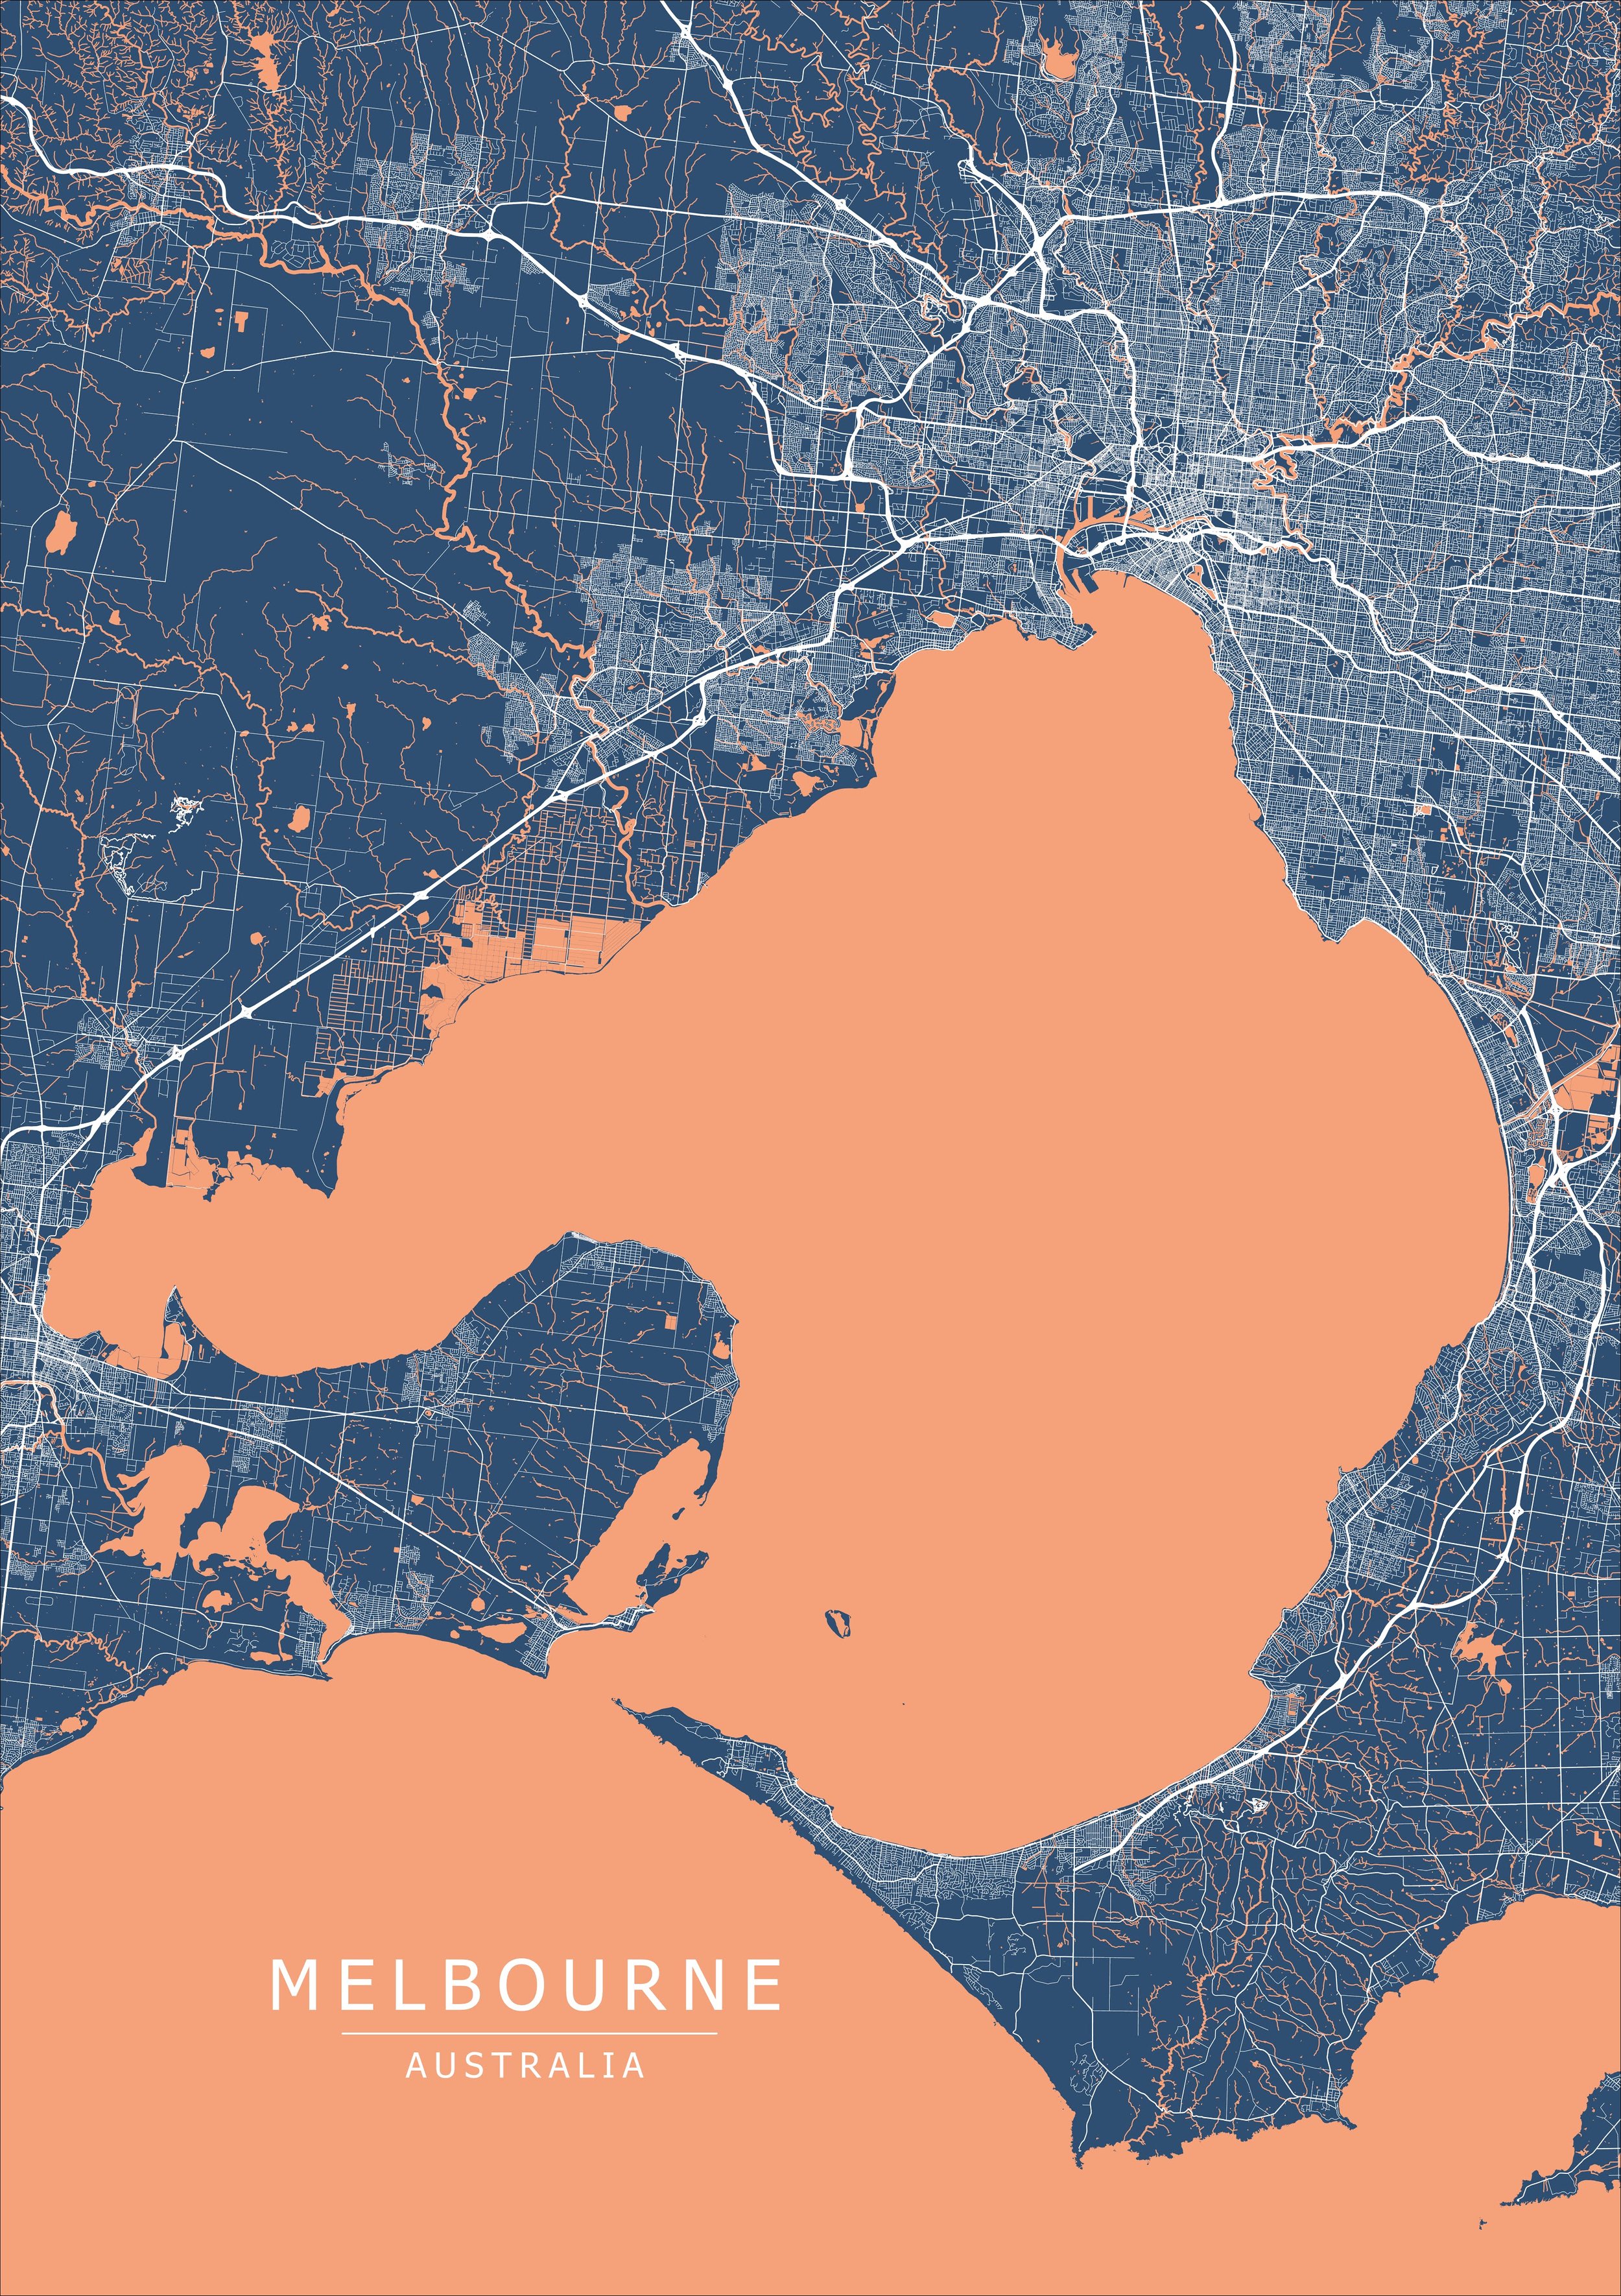
Traditional maps for reports, plans, and publications
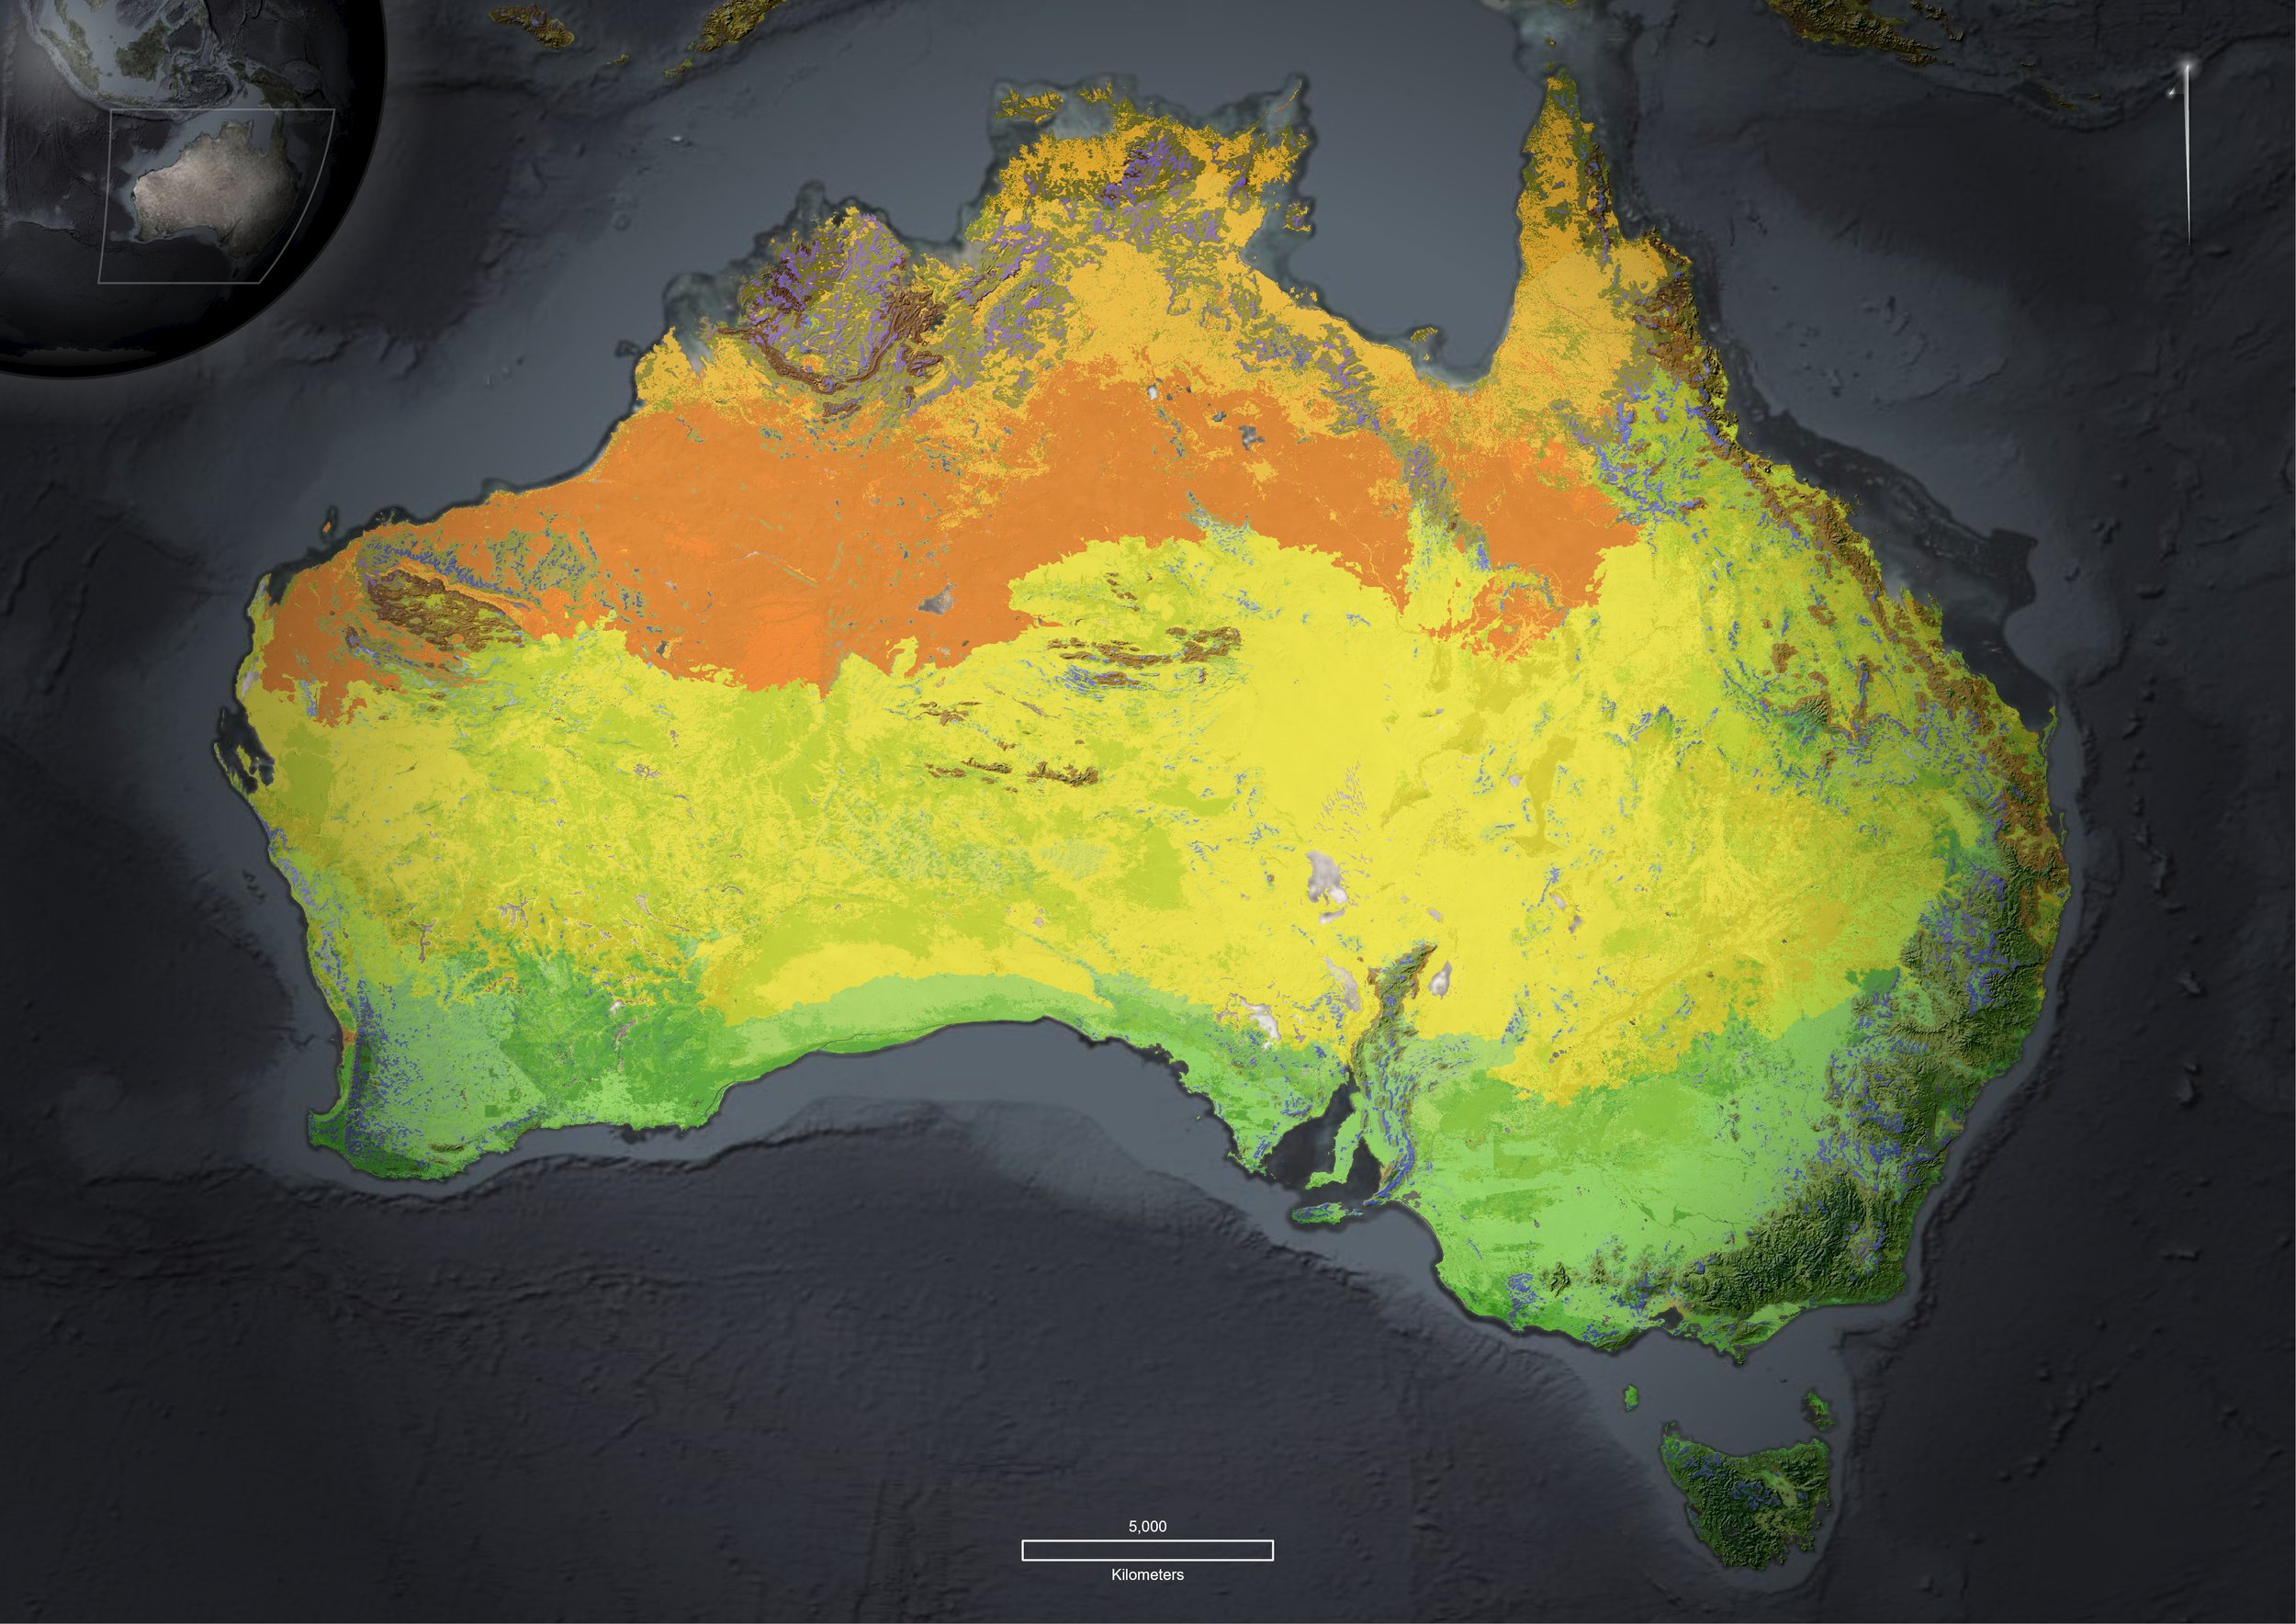
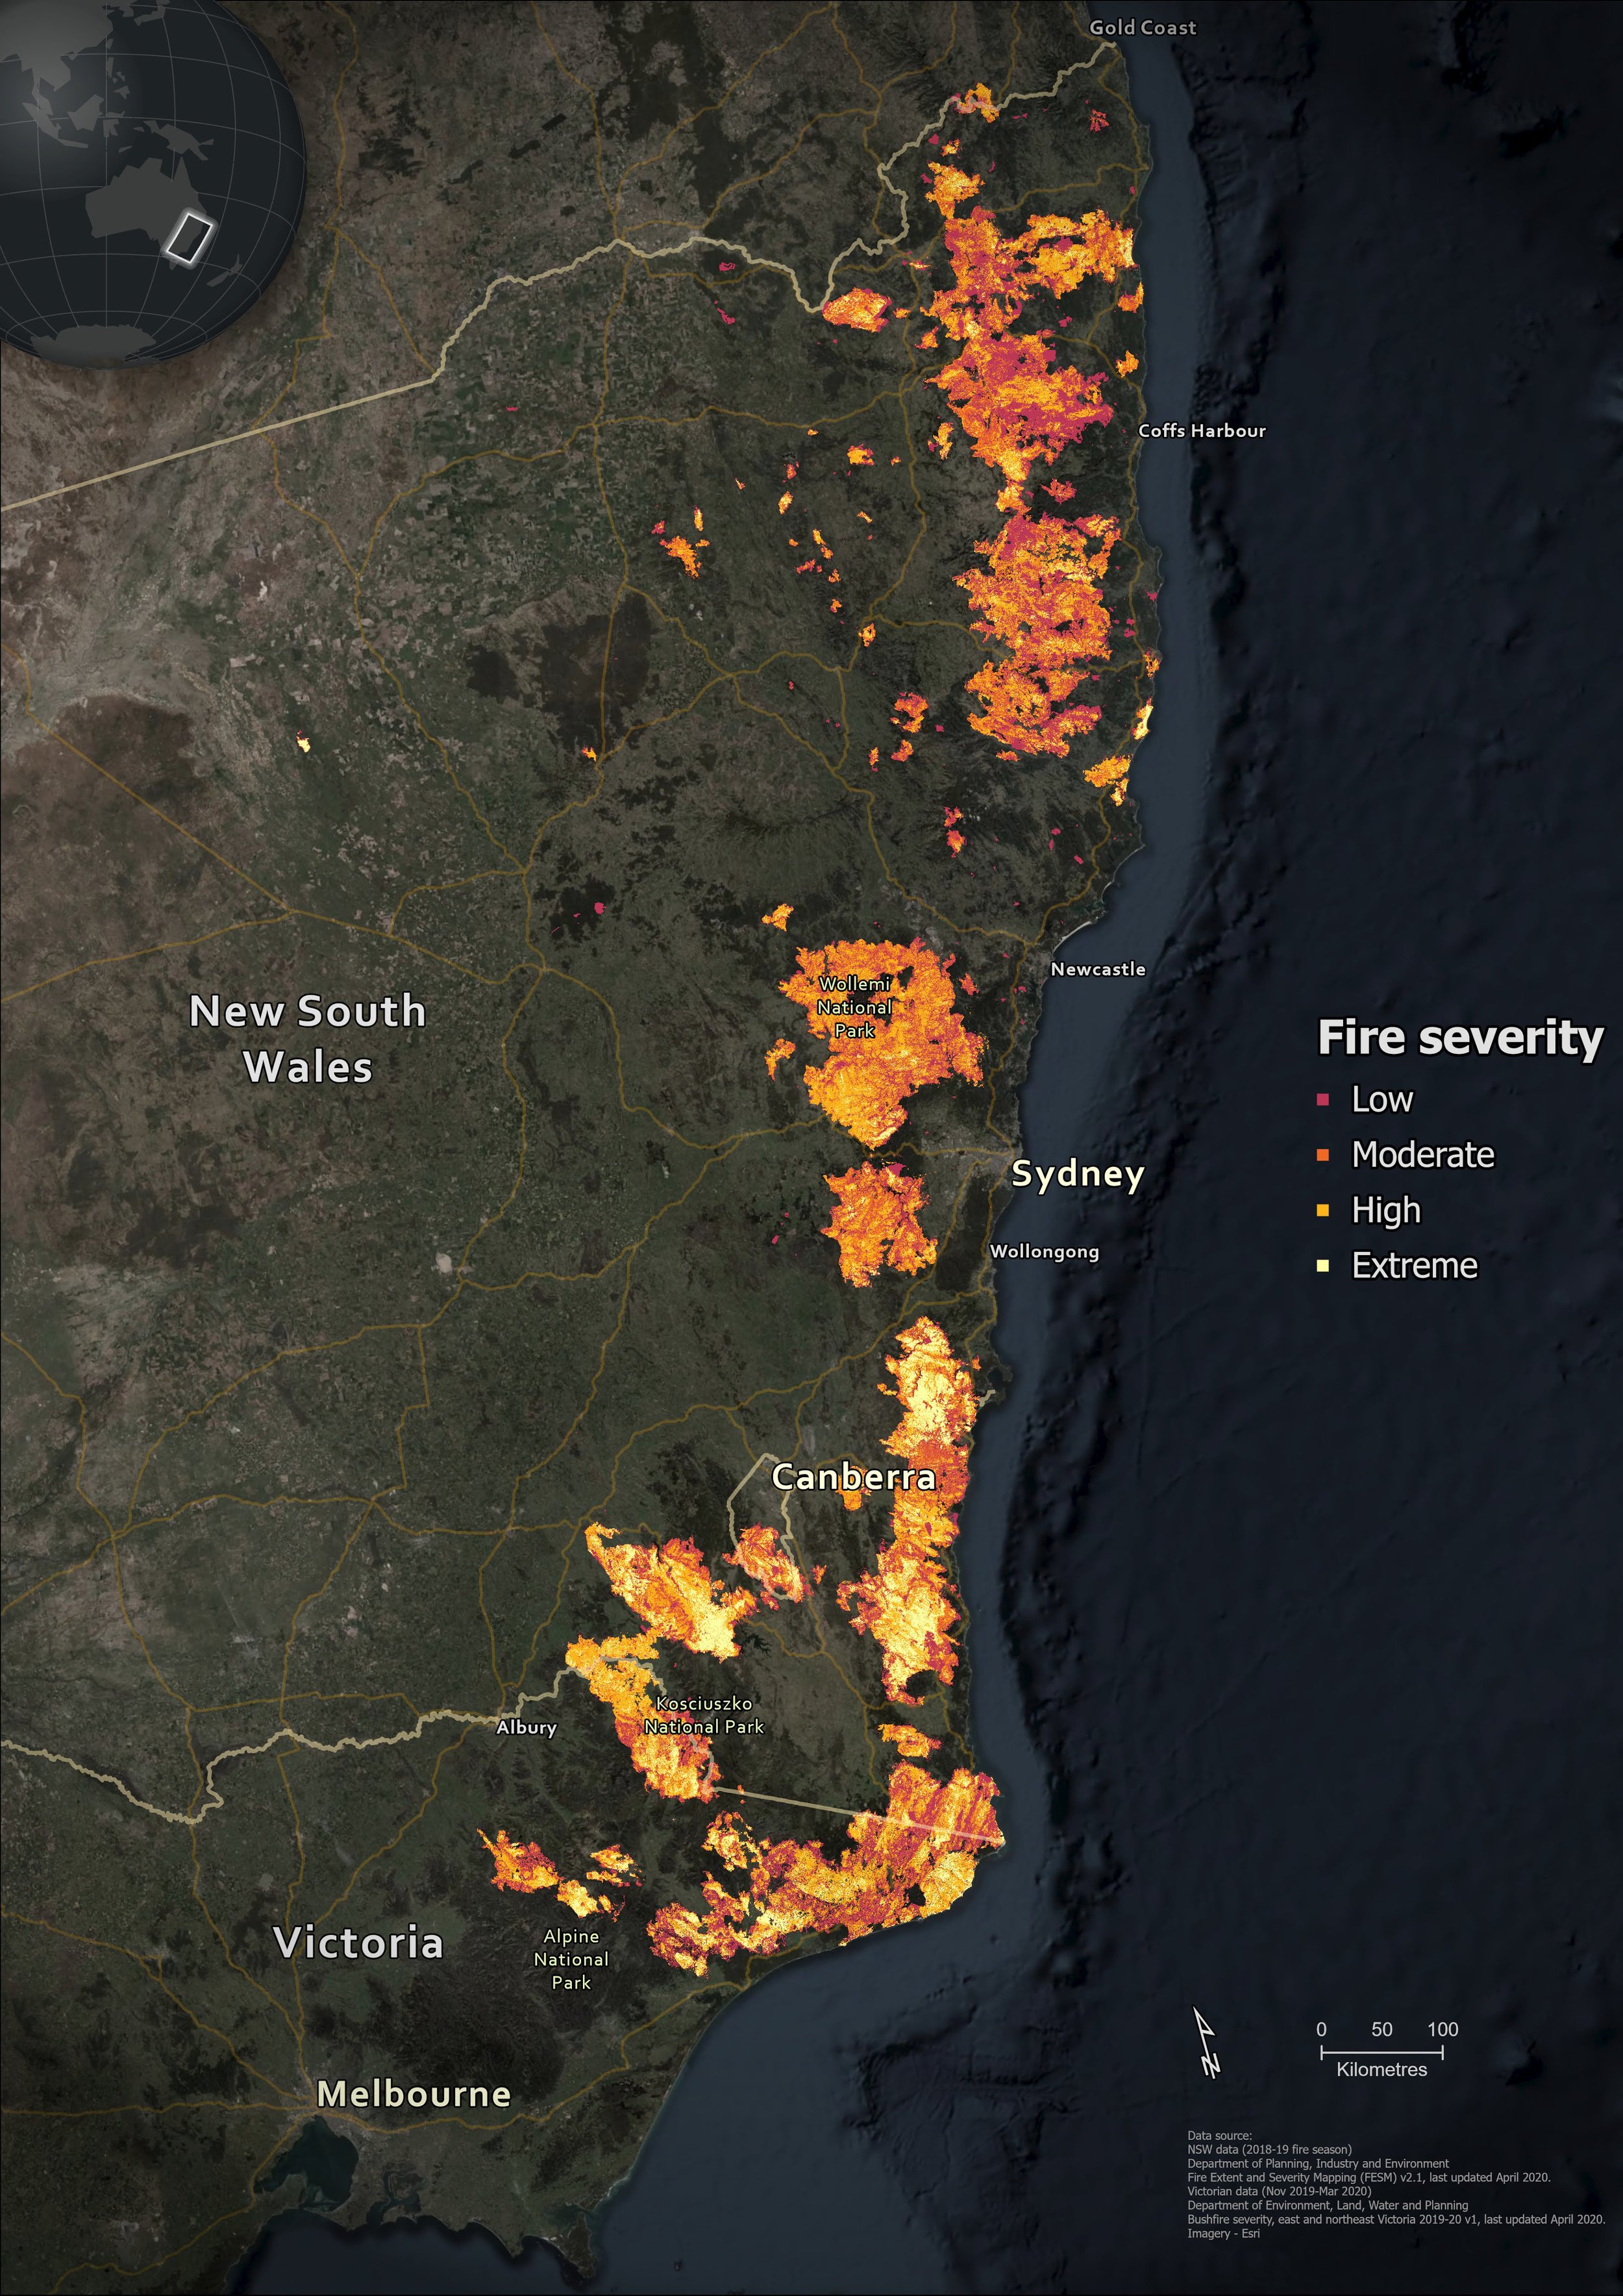
Thematic and topographic maps
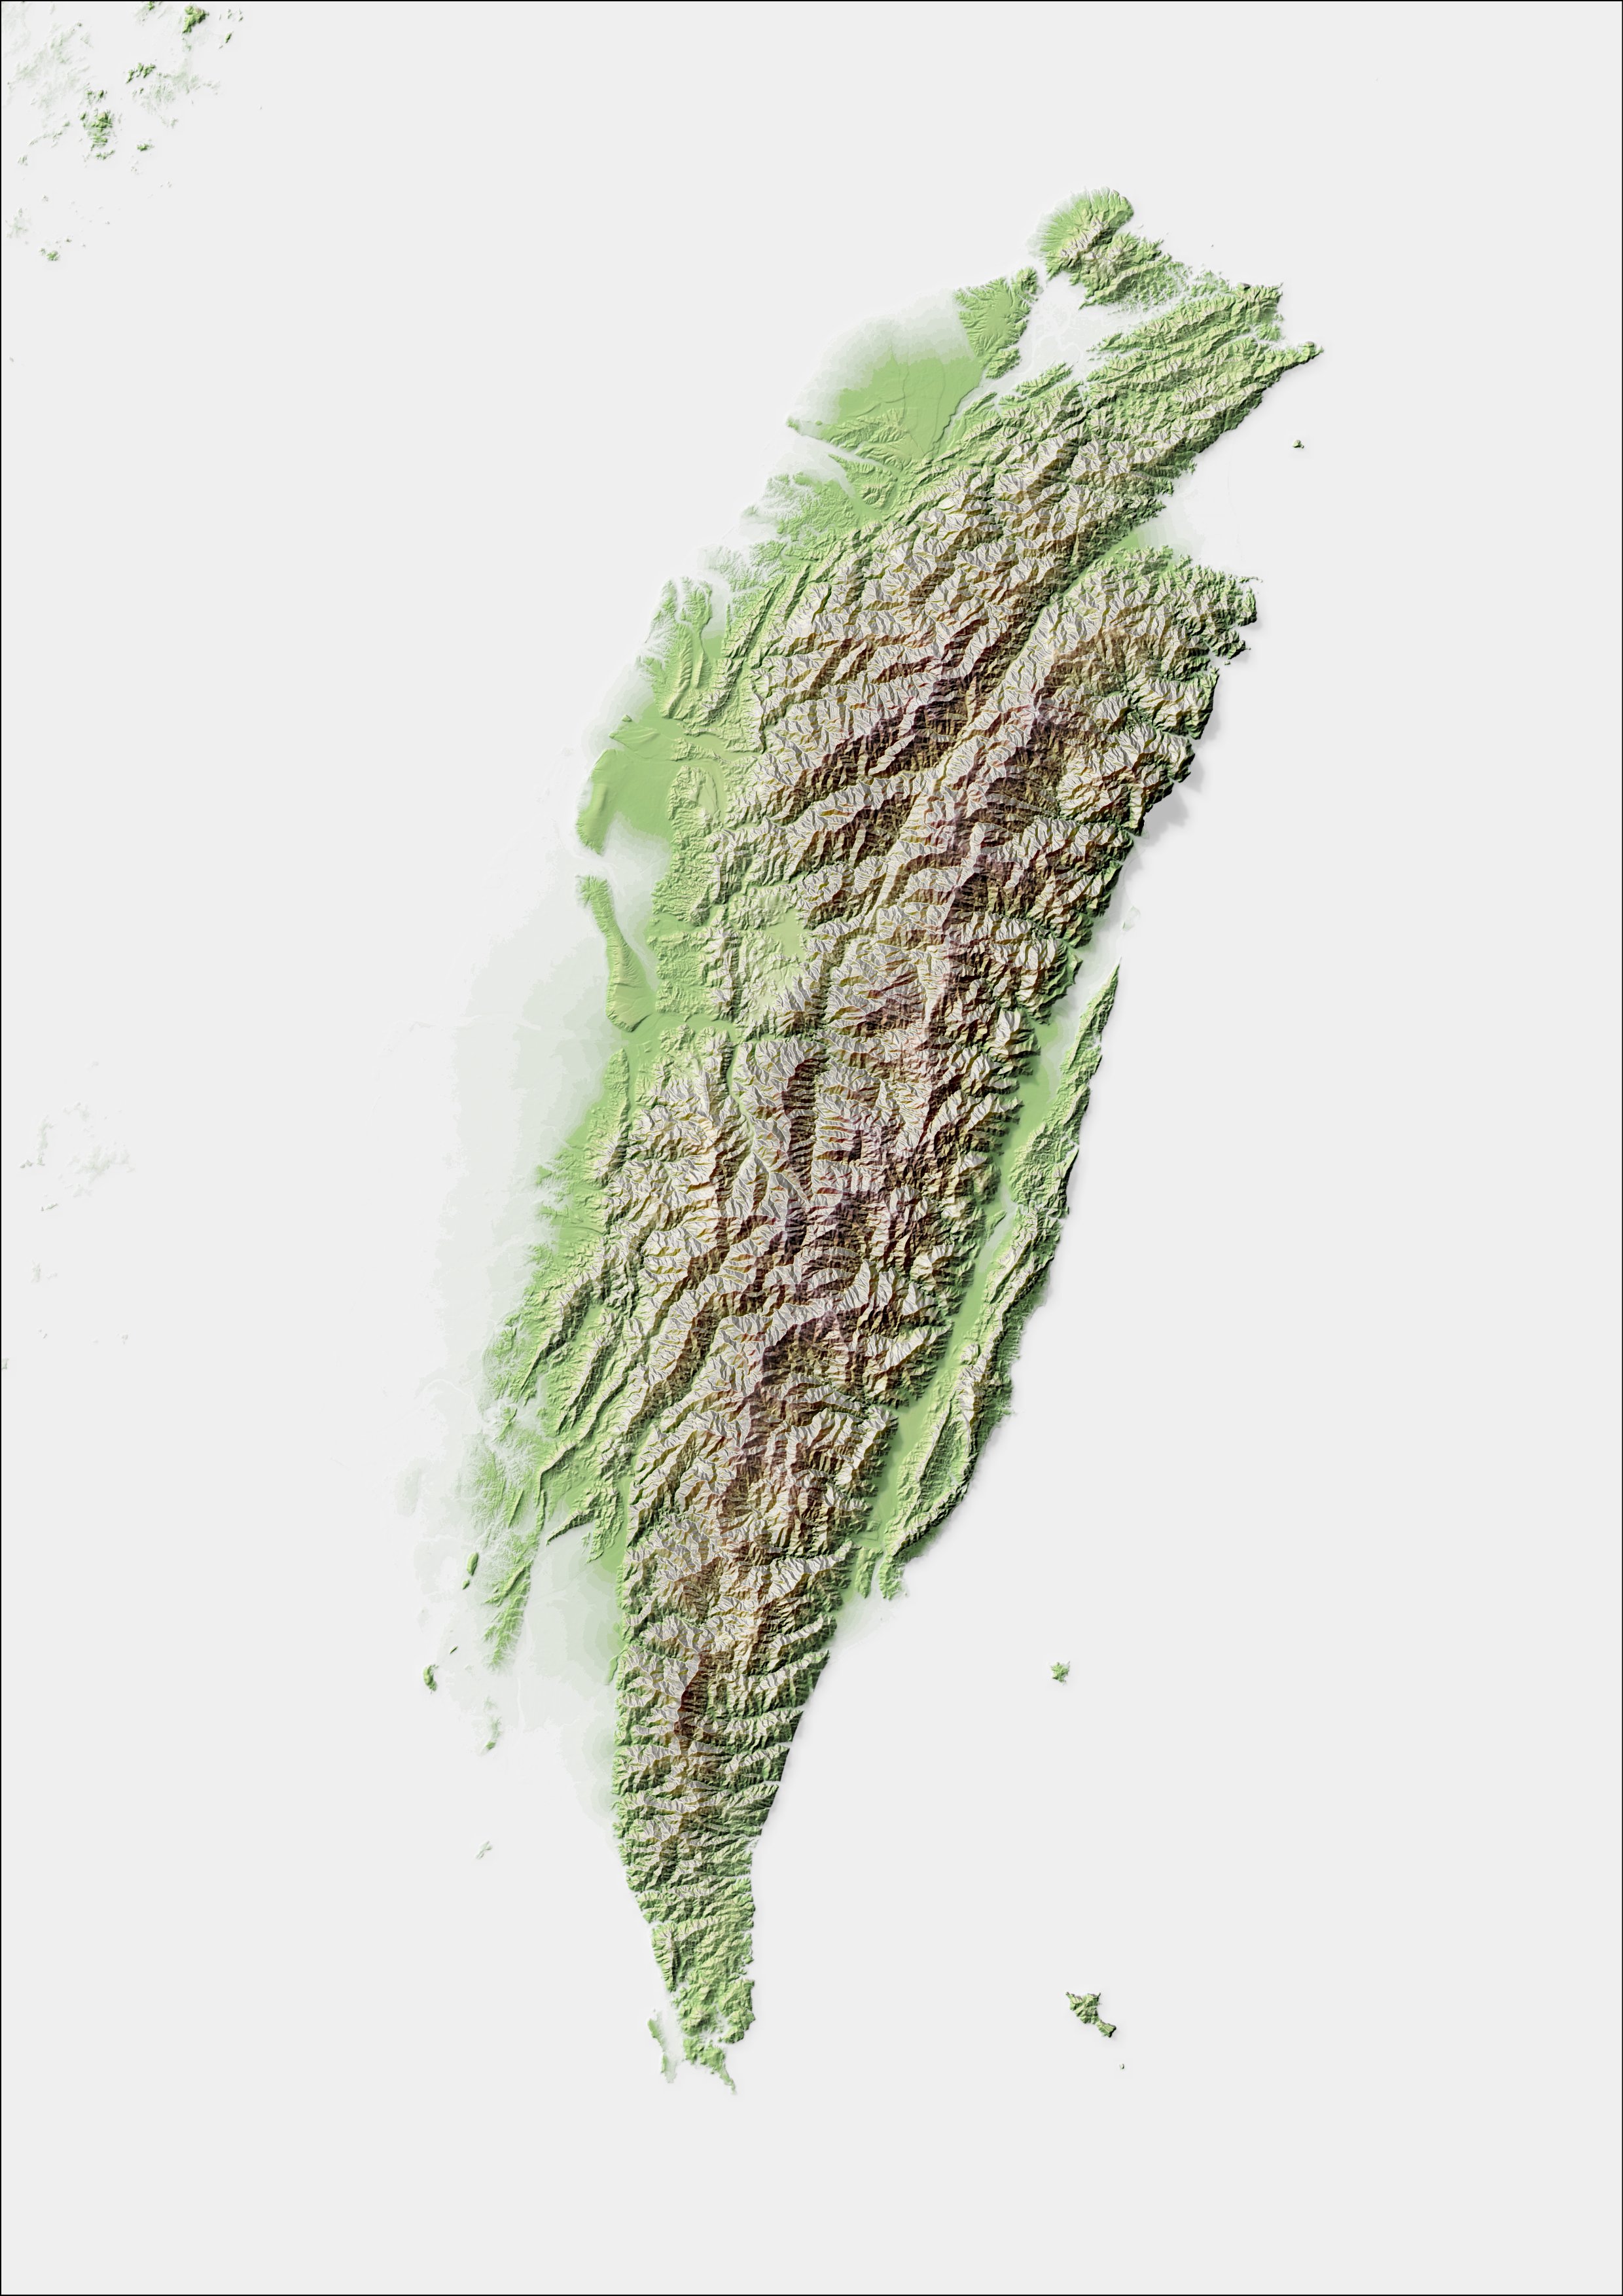
Relief and topologic mapping
Tourism and visitor maps
Layout and symbology design for visual clarity
Conceptual Site Models and spatial diagrams
Web & Mobile Mapping
Interactive web maps and dashboards
Custom mapping application development
Mobile mapping solutions for field data collection
Public-facing maps for engagement and transparency
Imagery & 3D Products
Orthomosaic production from drones, satellite, and scanned imagery
Orthorectification and image alignment
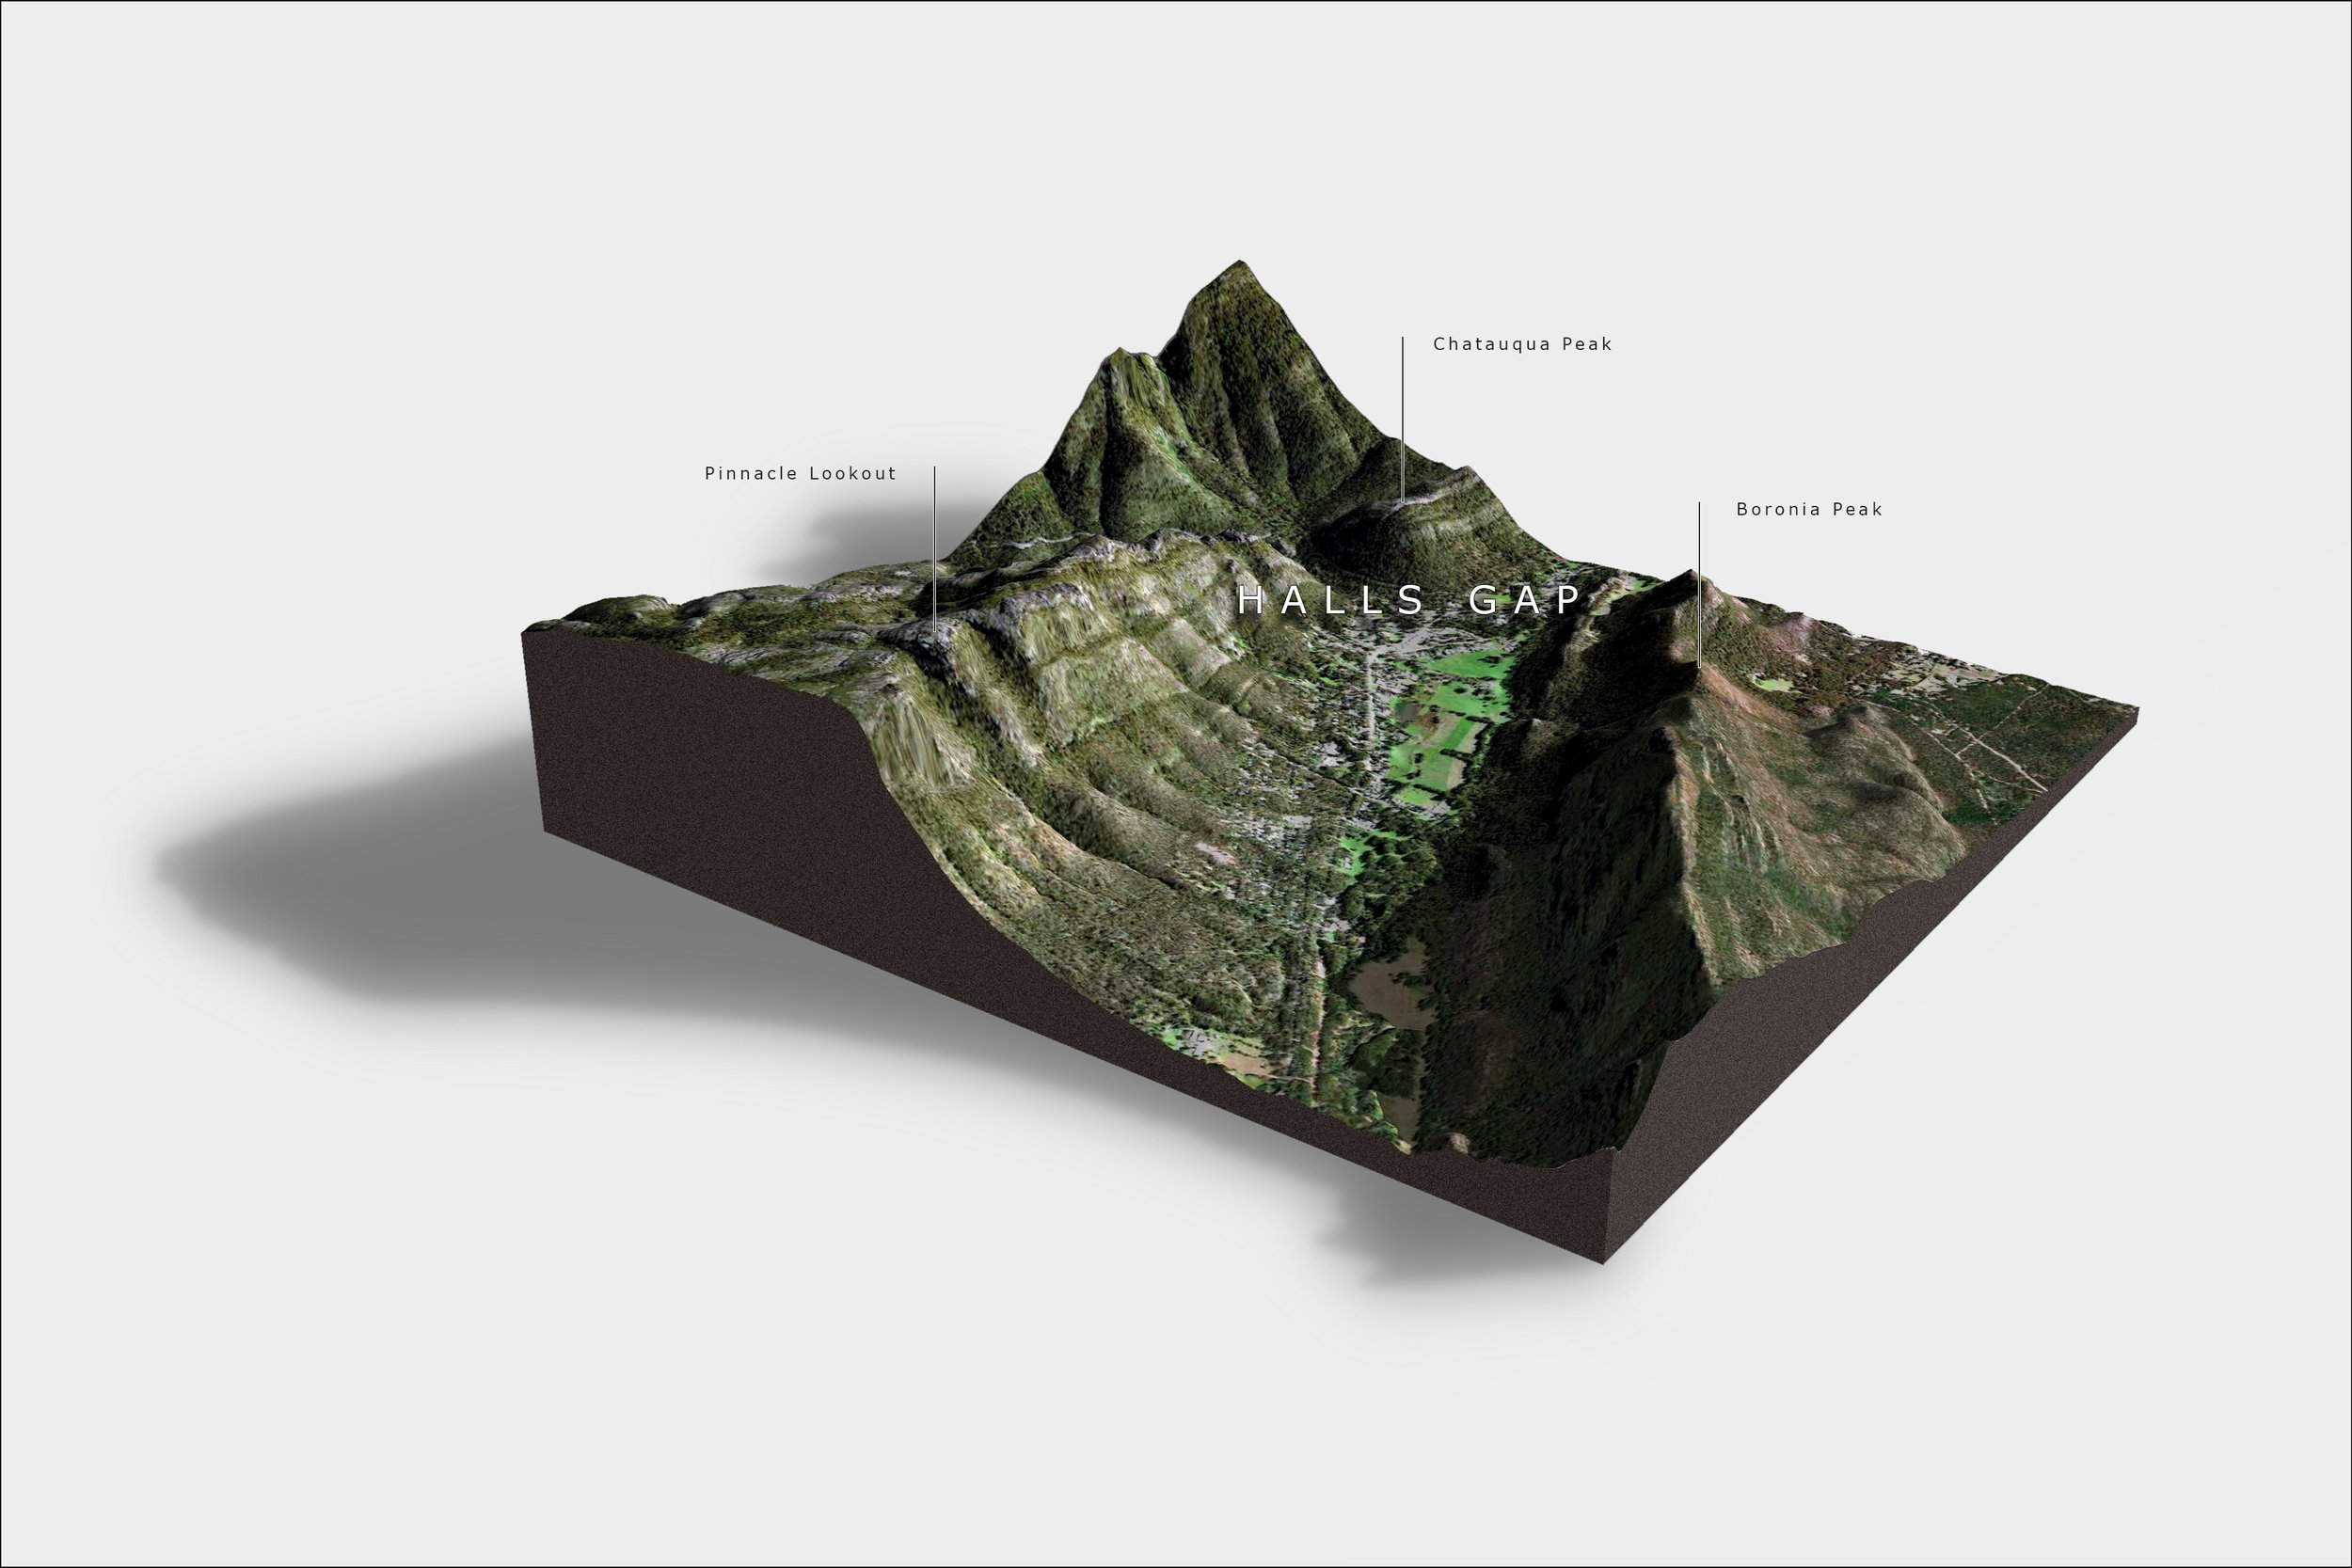
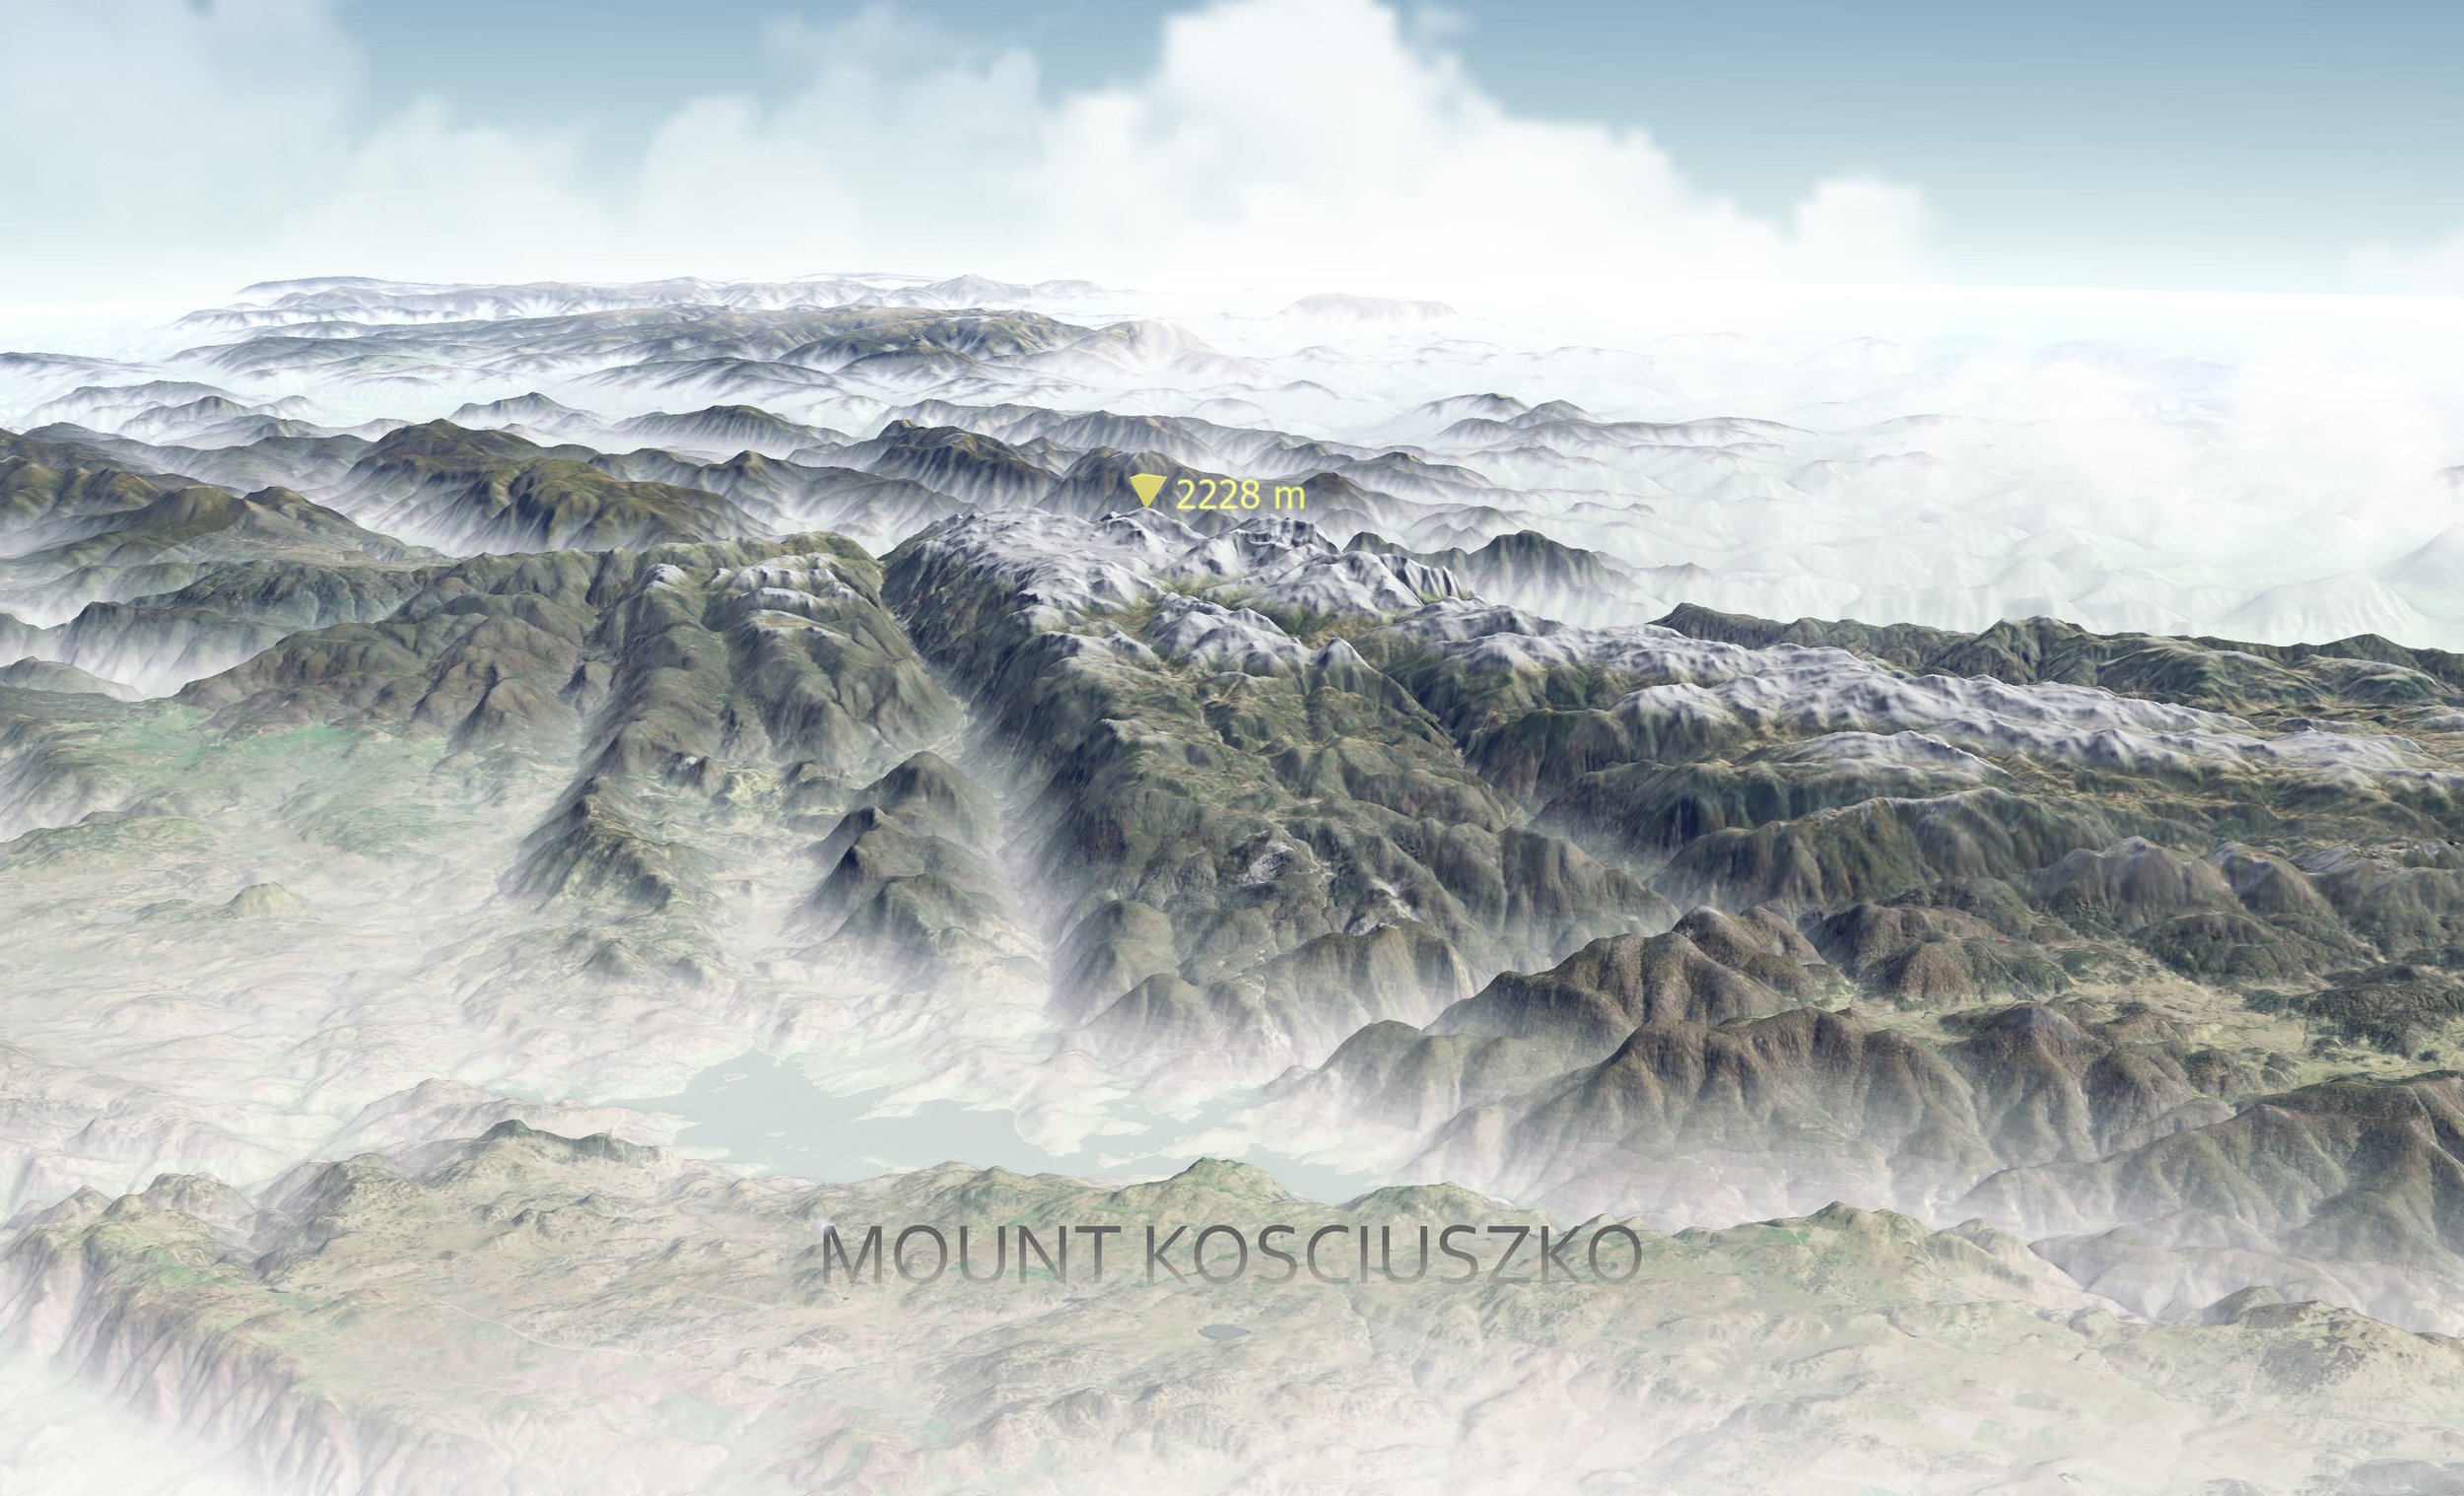
Digital terrain models (DTM) and surface models (DSM)
3D visualisations and fly-through animations
Remote Sensing & Index Analysis
Processing of multispectral and hyperspectral imagery
Vegetation and water index mapping (e.g. NDVI, NDWI, SAVI)
Custom raster analysis and index generation